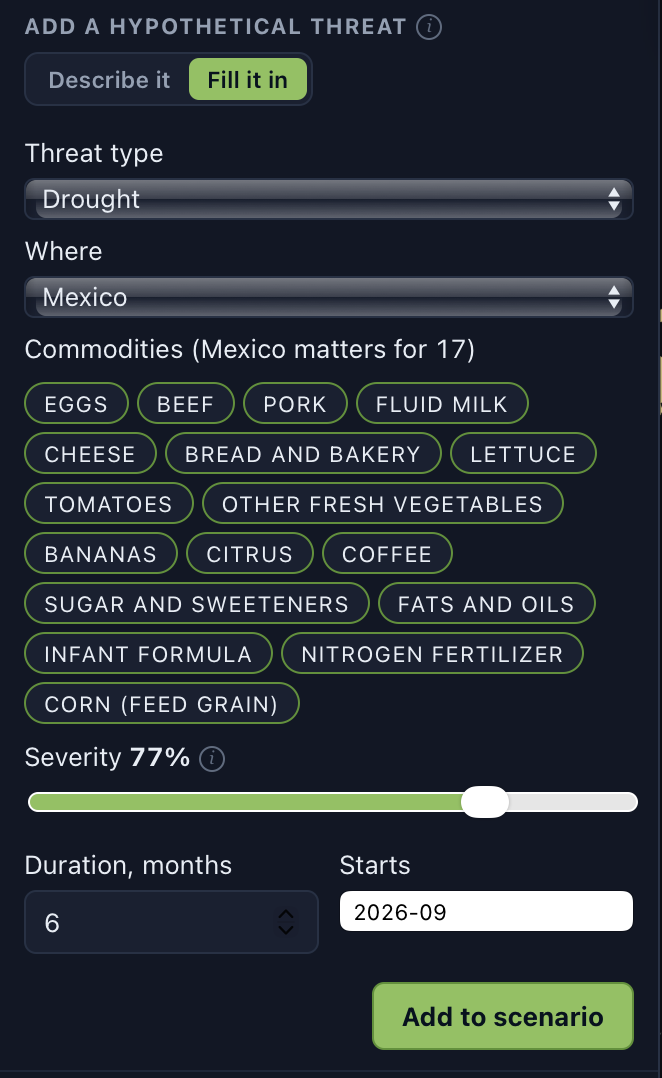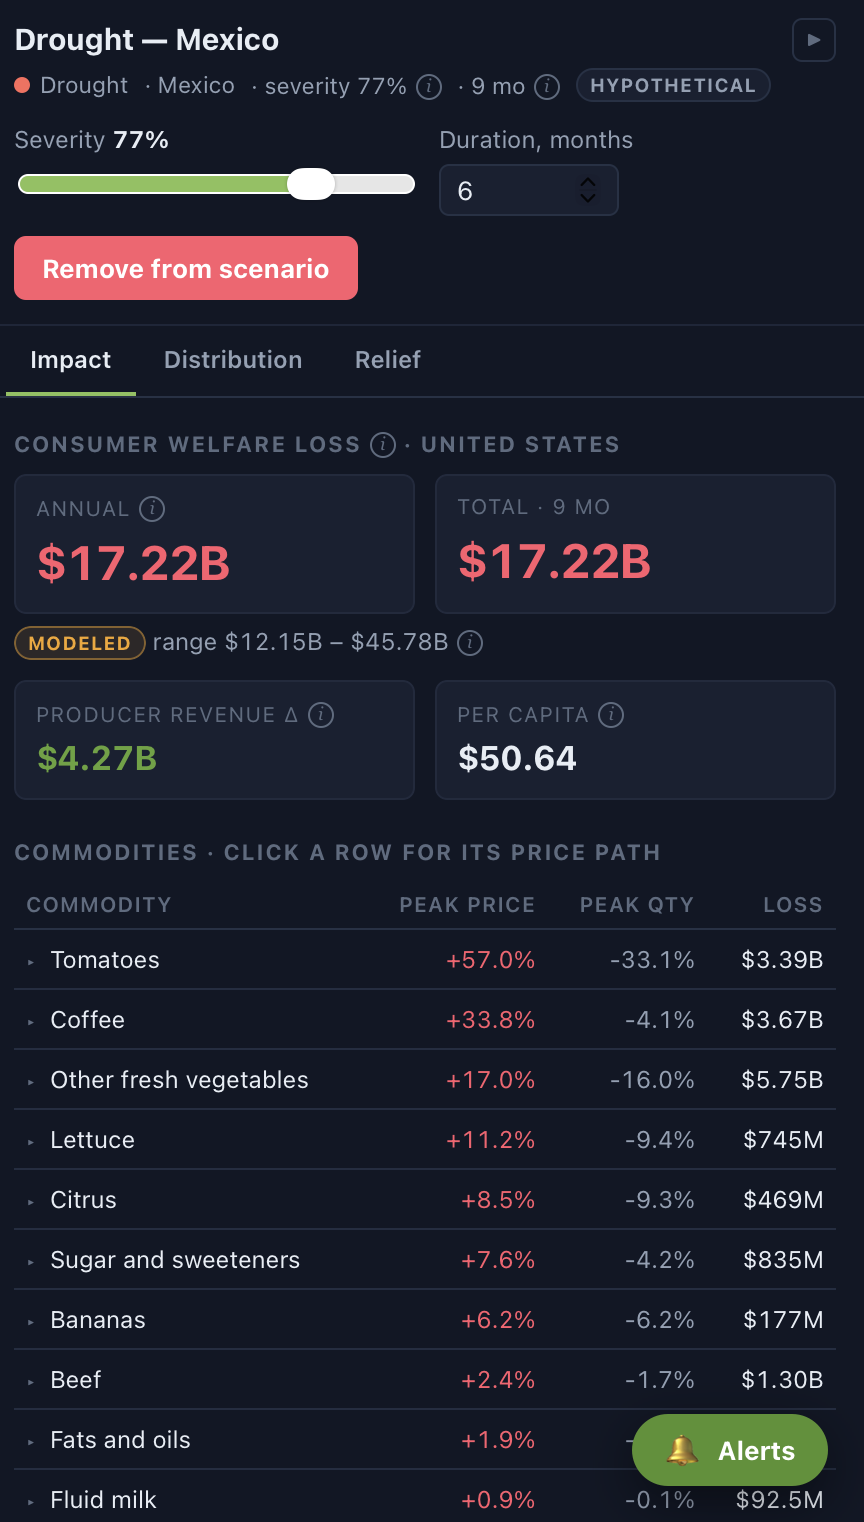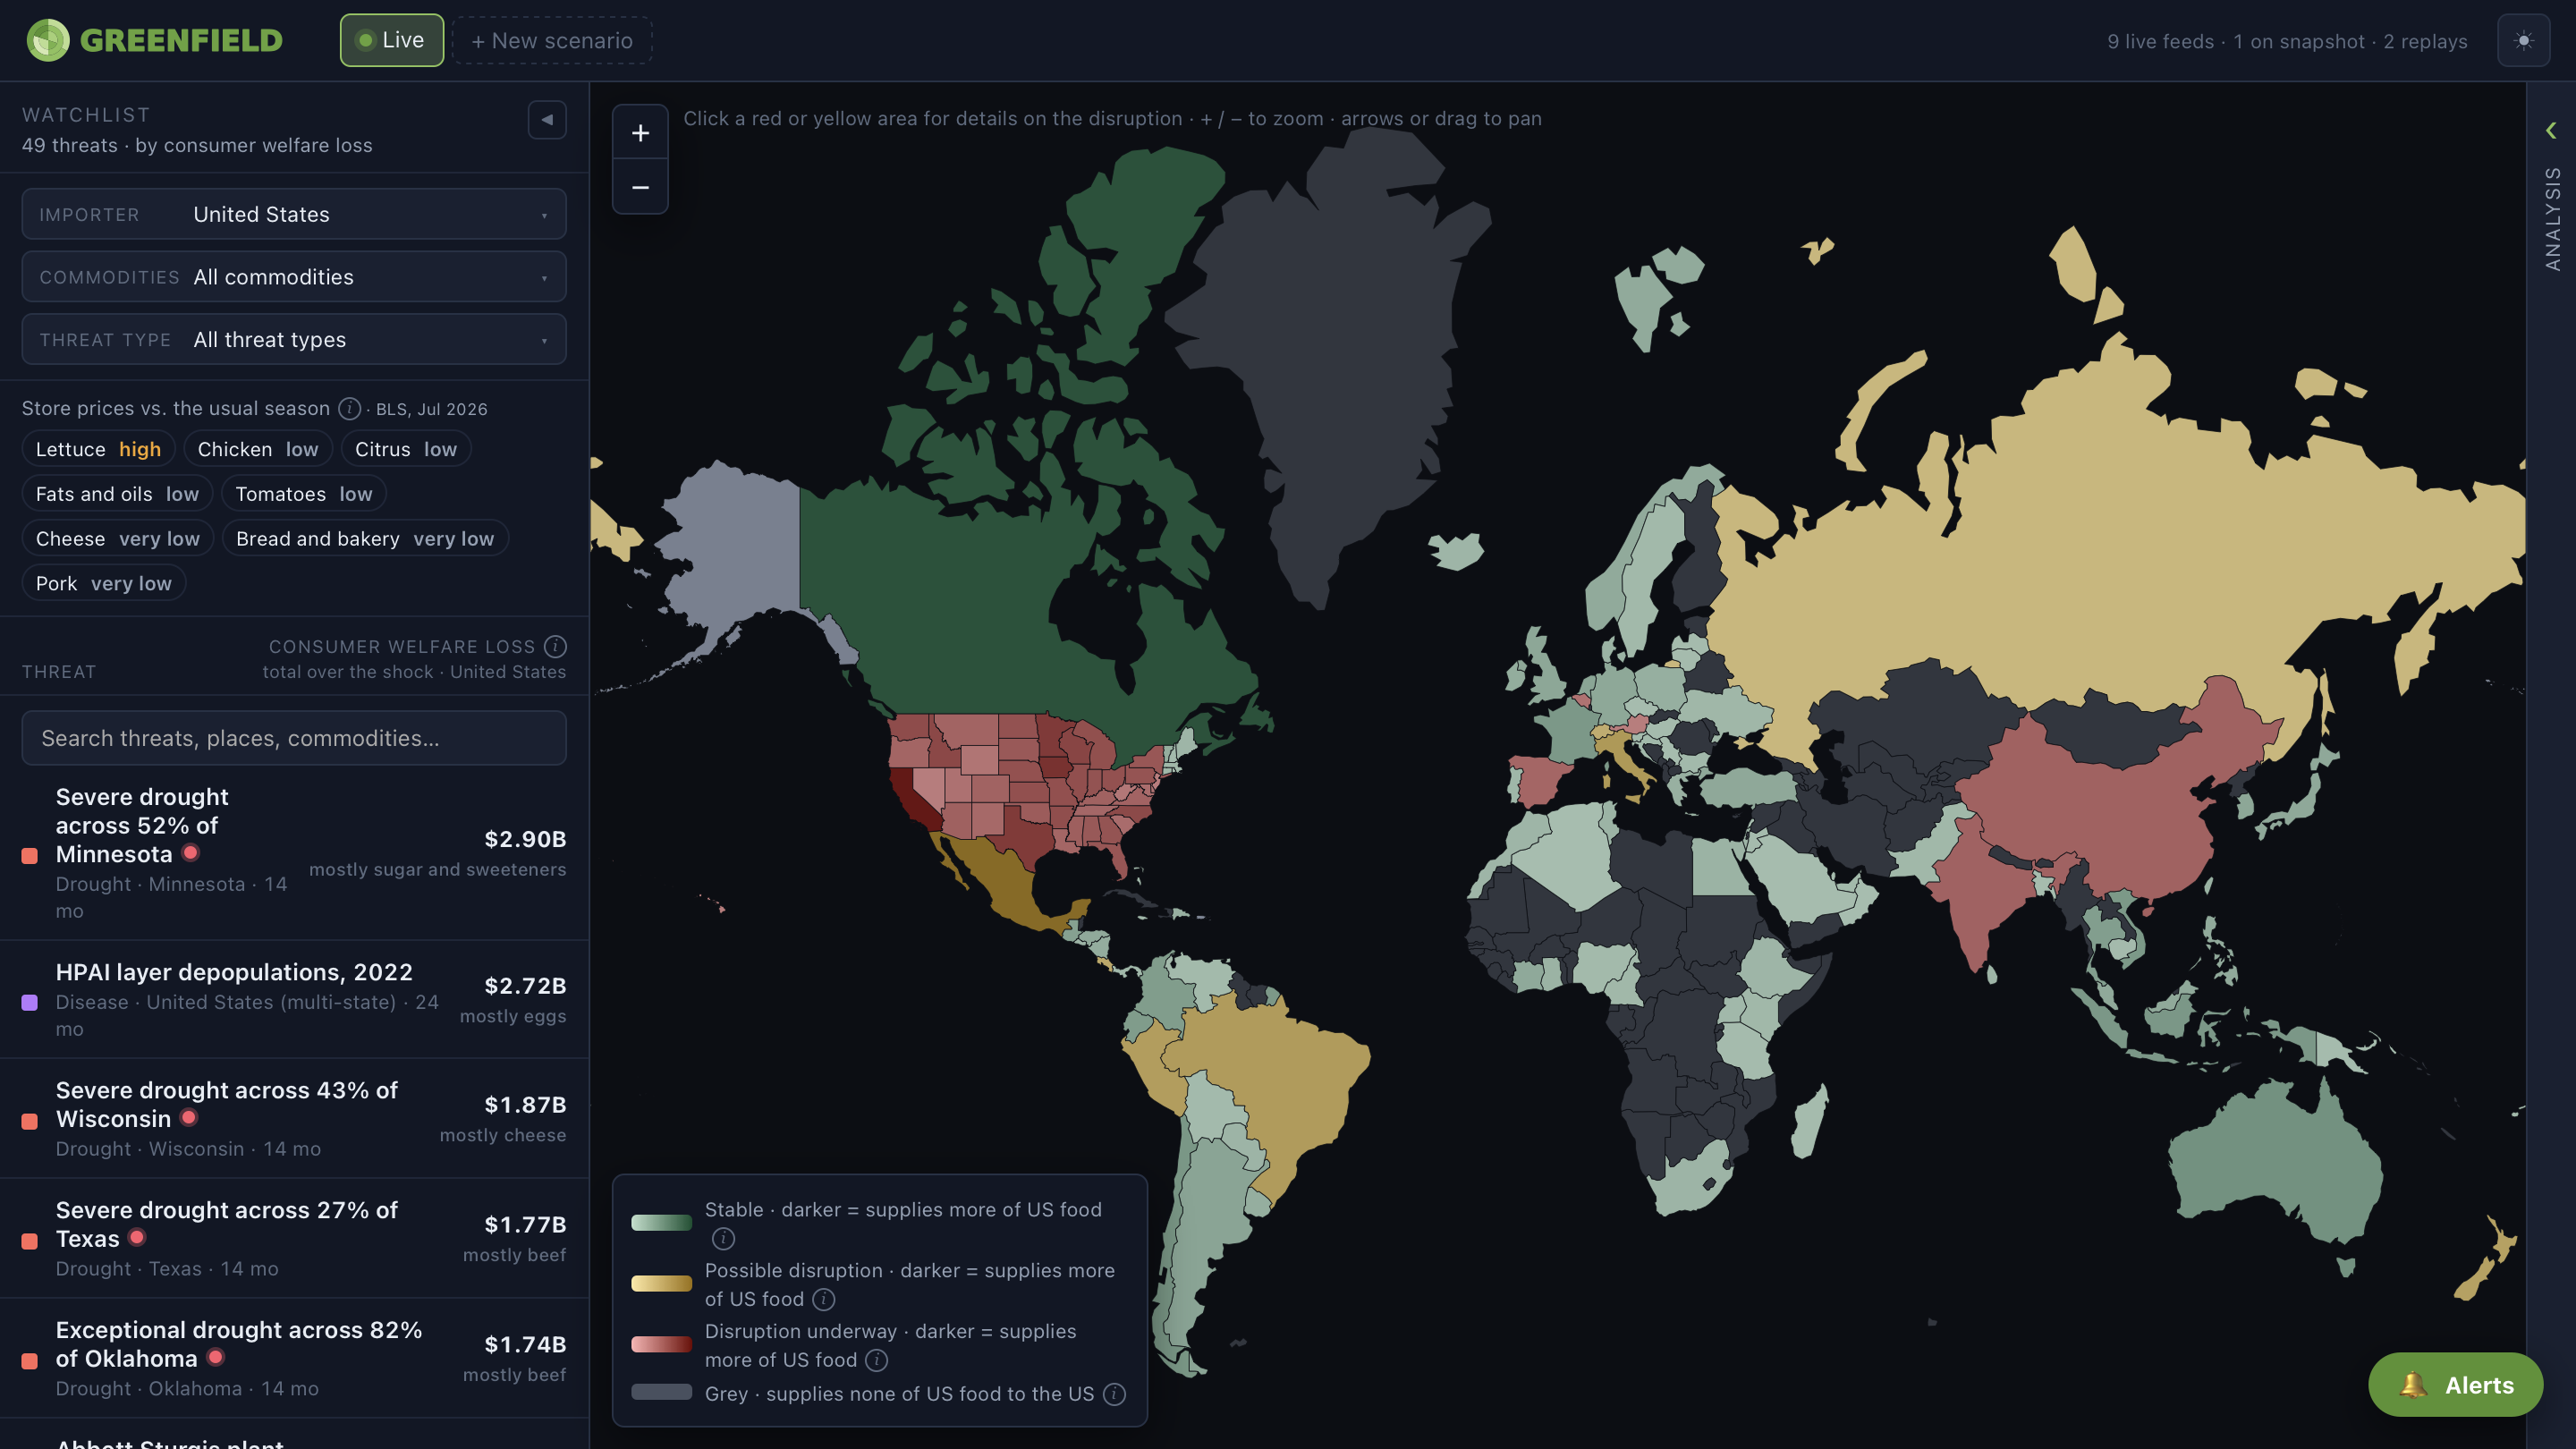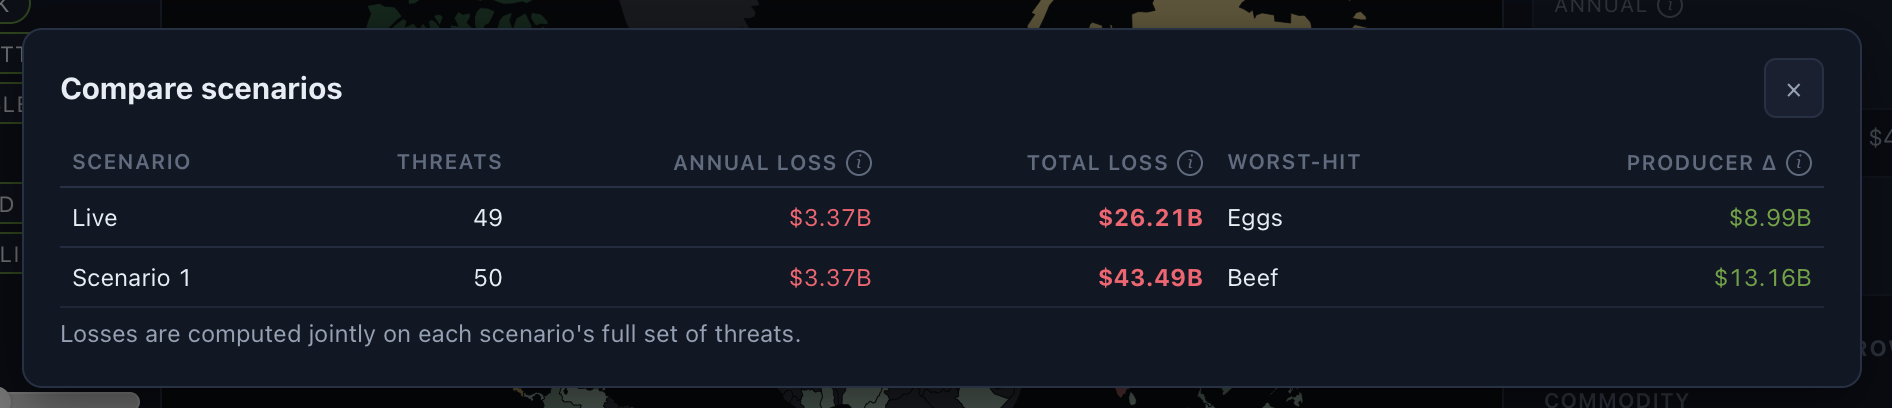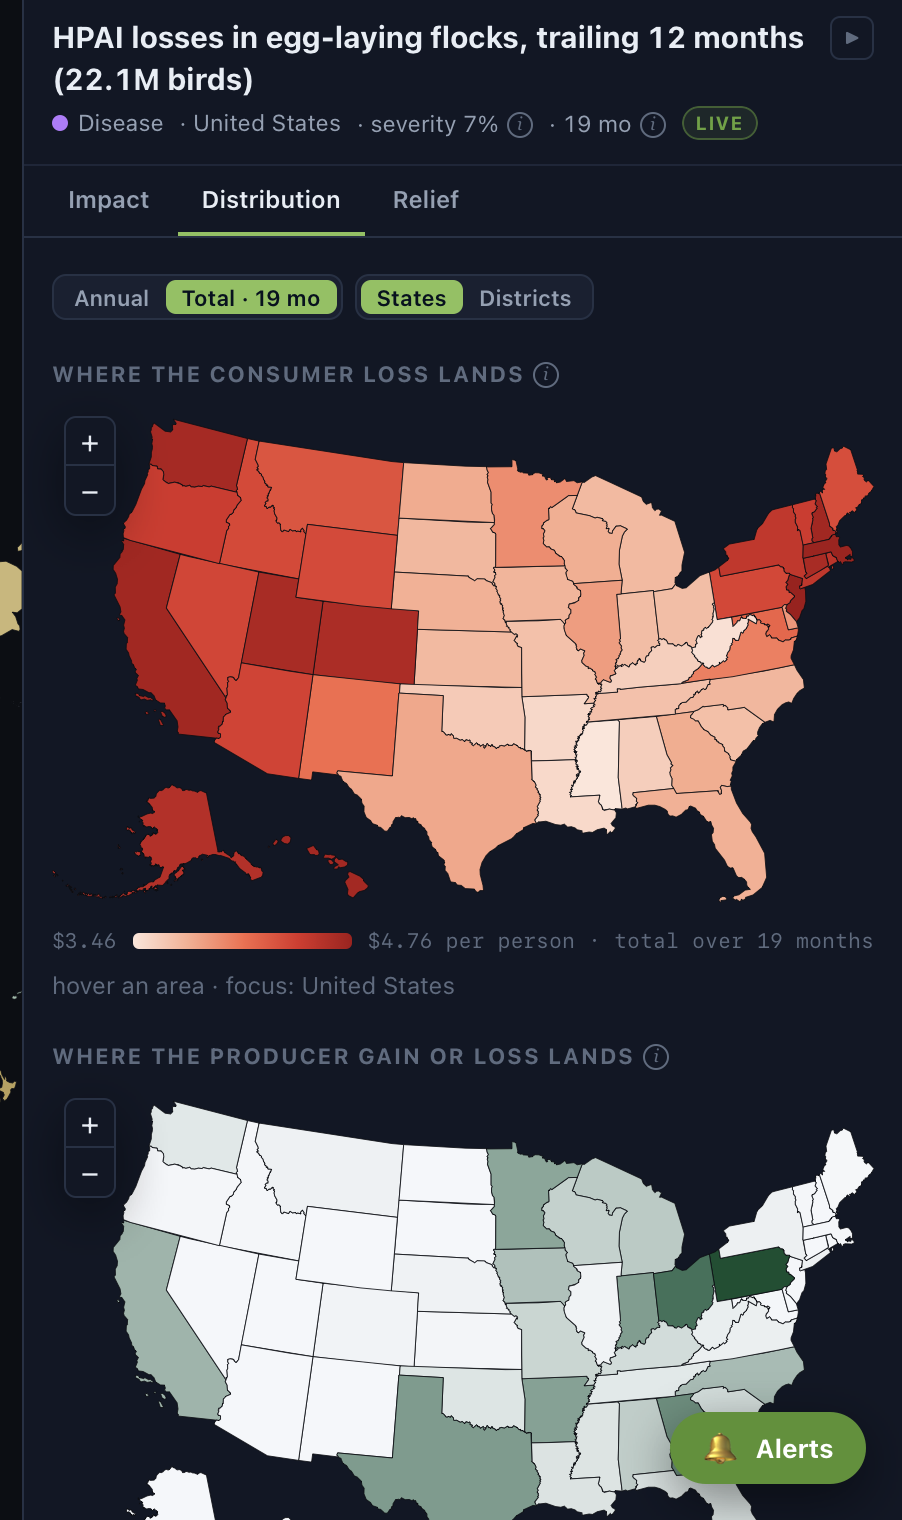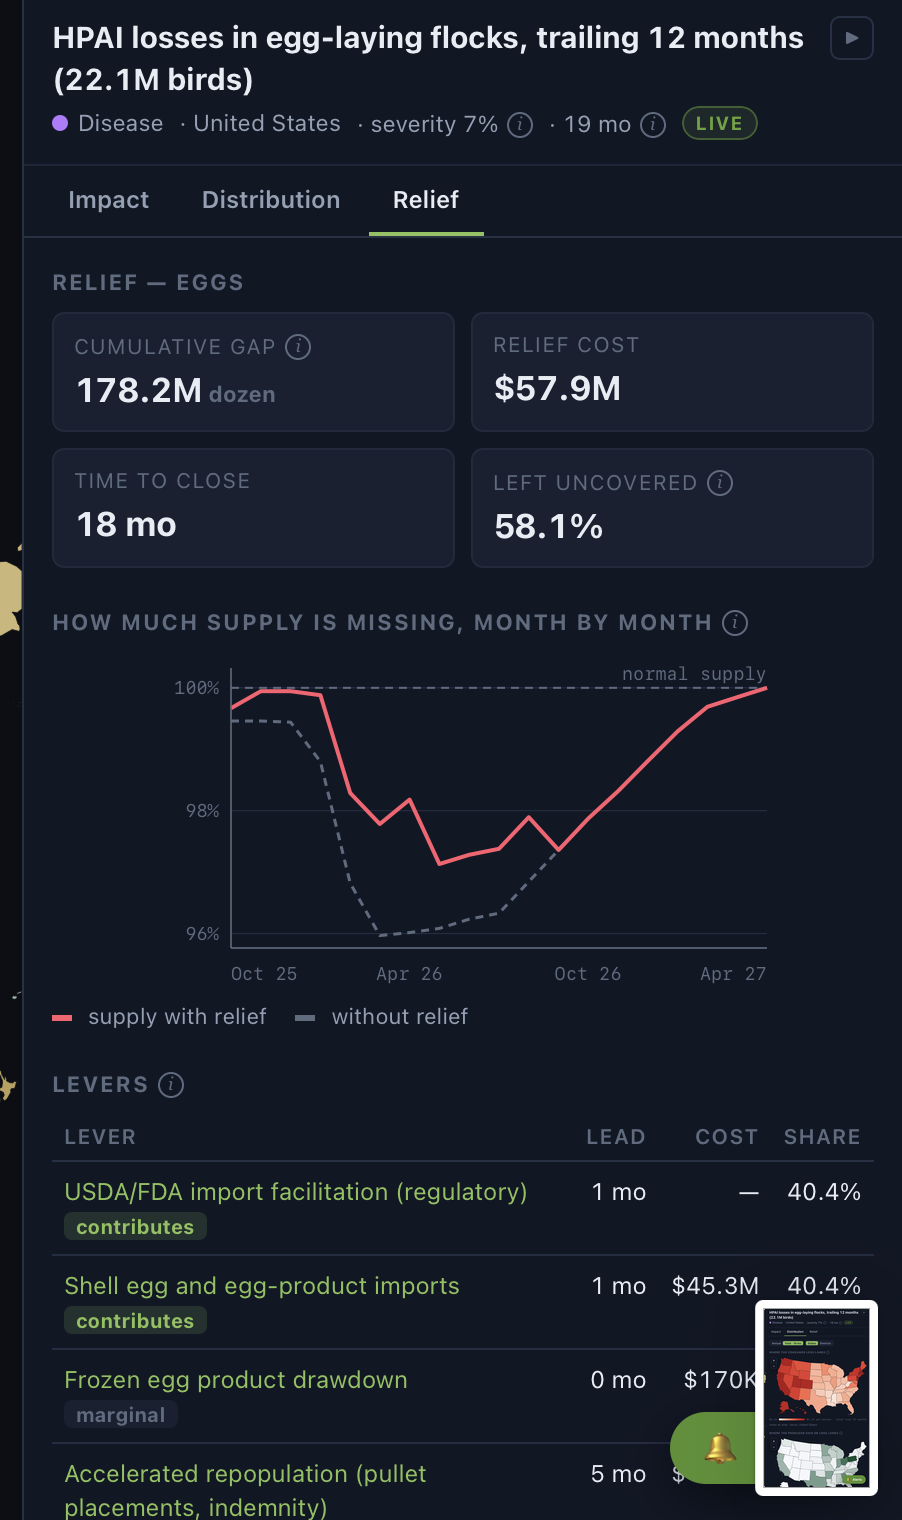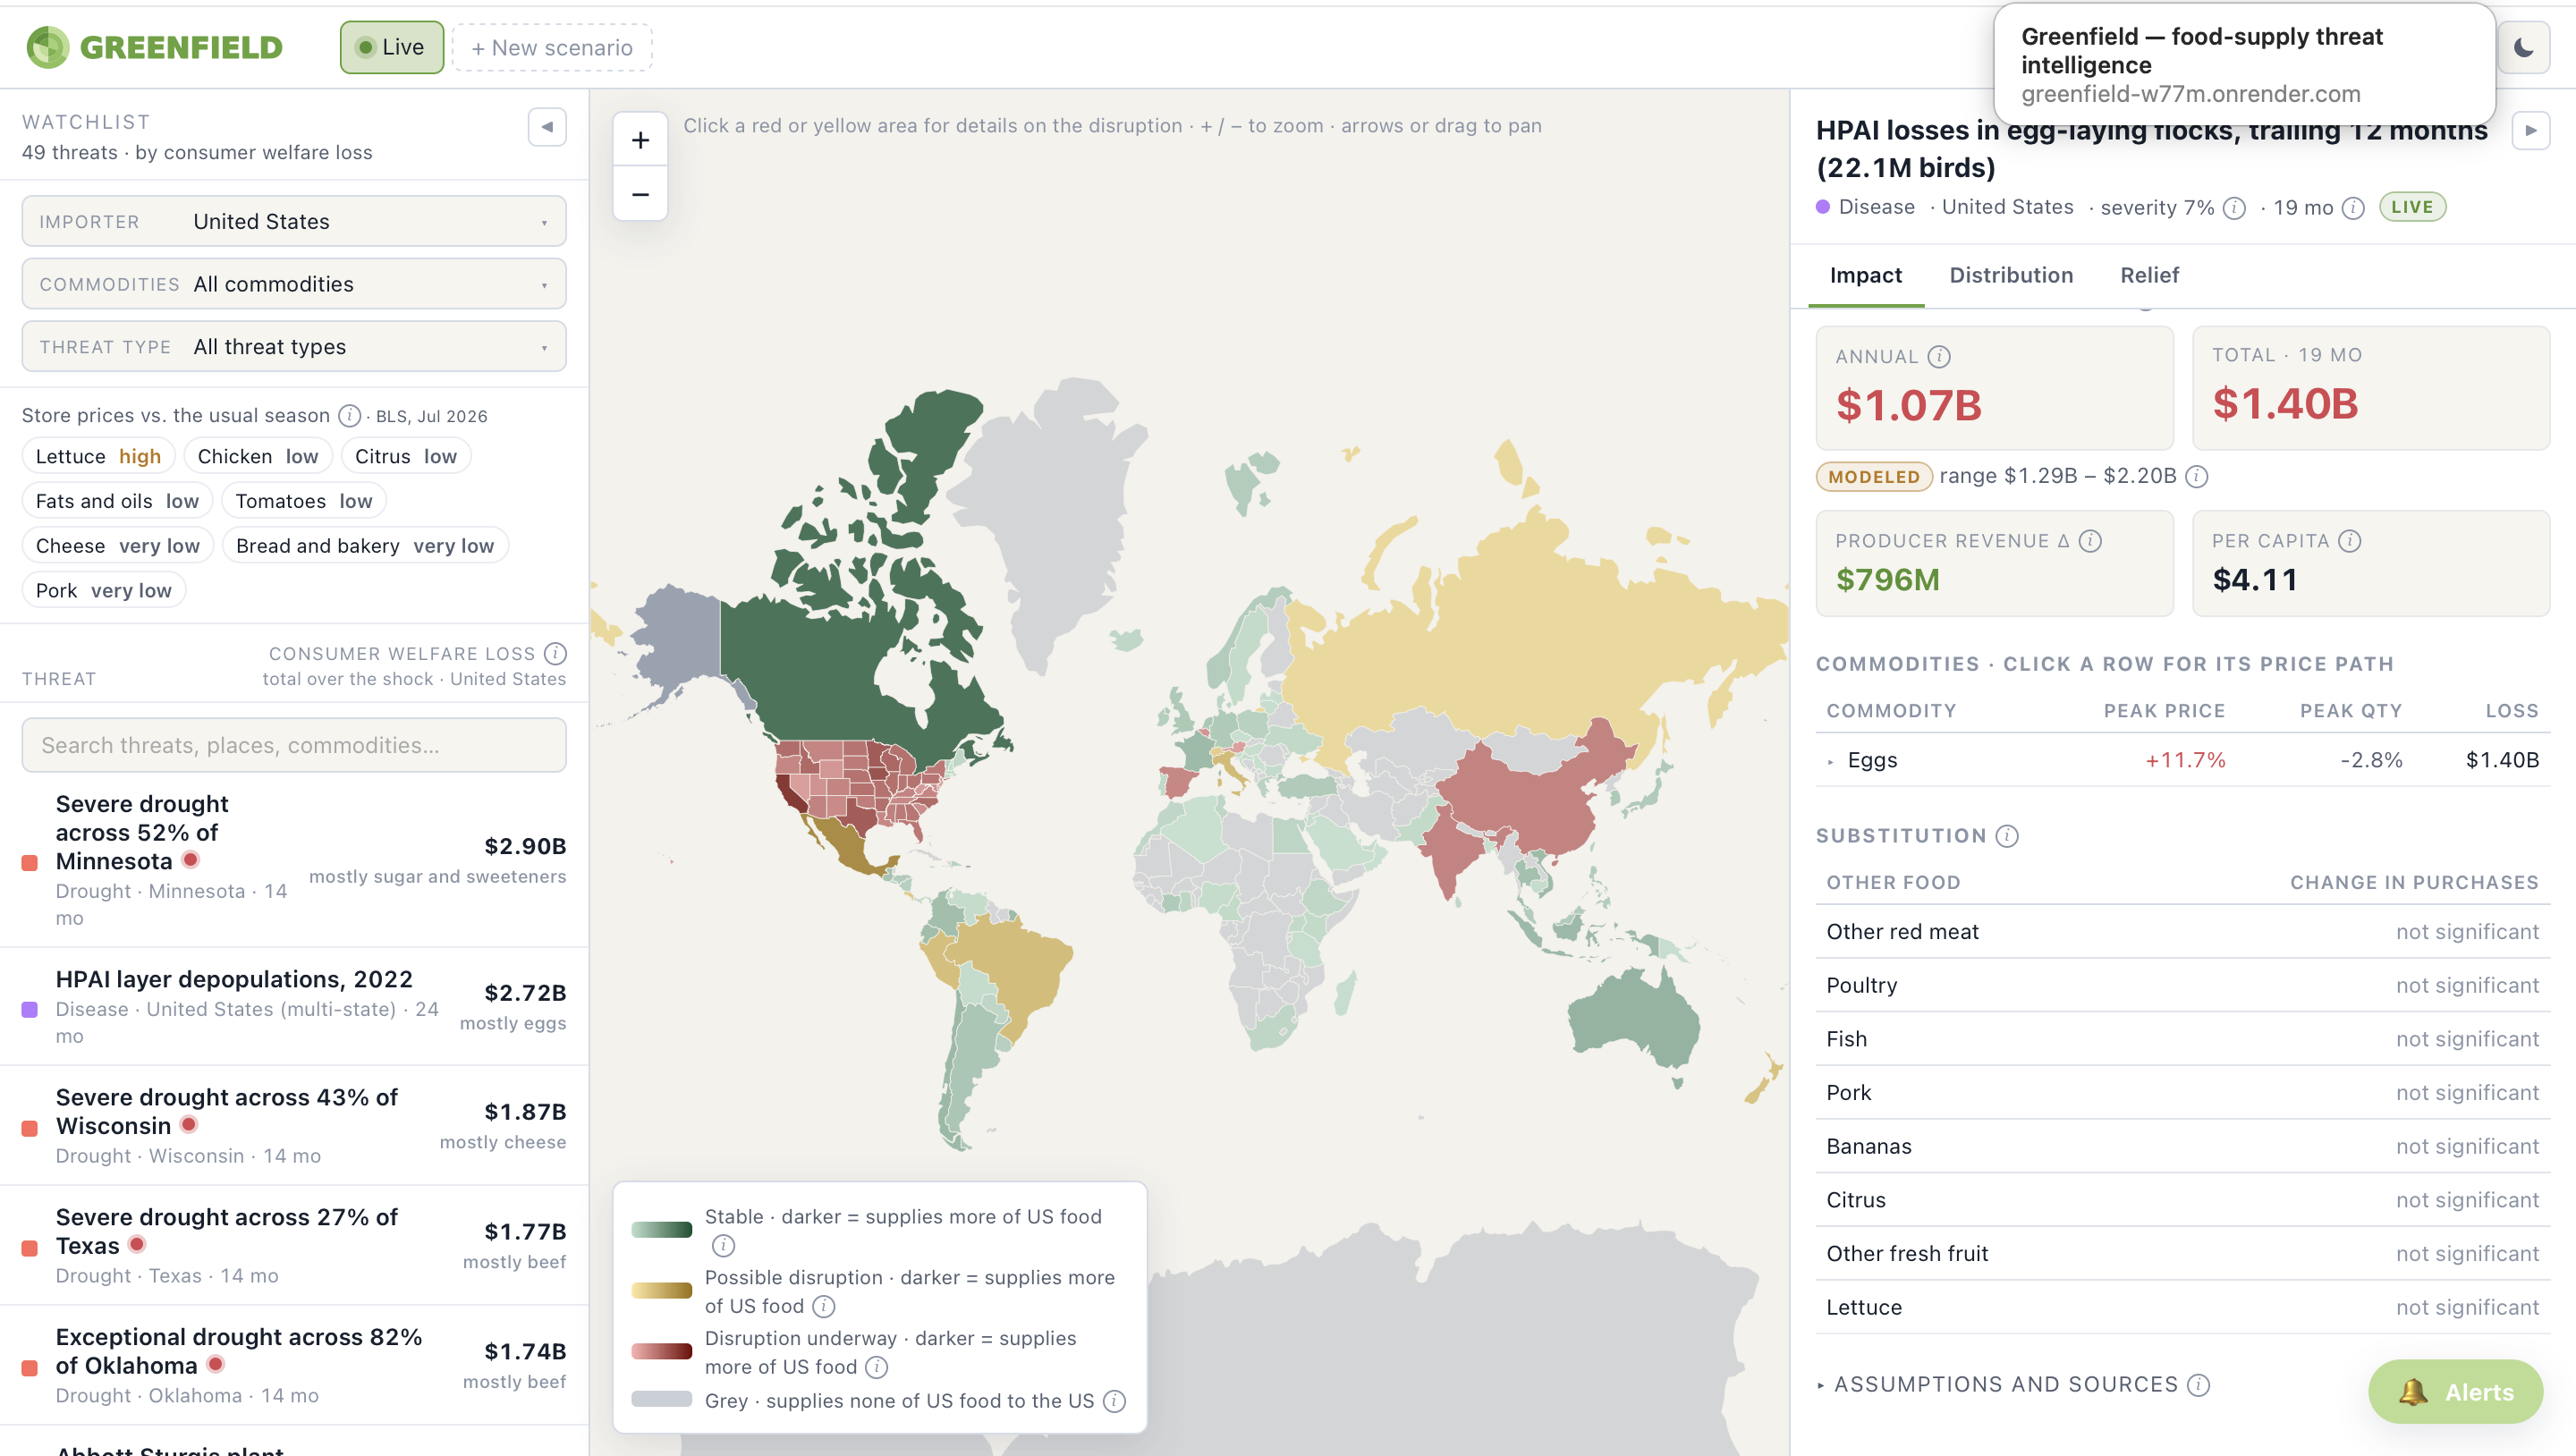
Greenfield is a live map of threats to the American food supply, from bird flu in Iowa to a coffee shortfall in Brazil, shown as the impact in dollars for the people who consume and produce the food. It pulls official feeds every hour (USDA APHIS, the US Drought Monitor, NASA fire data, IMF shipping-lane counts, Census import statistics, BLS store prices) and screens the news for disruptions that have not reached the data yet. Every threat runs through a deterministic economic model built on USDA demand estimates, so each one carries a consumer welfare loss, a price path, and a breakdown by state and congressional district. Staff can filter to their district and commodities, build what-if scenarios with severity and duration dials, compare relief options, and get email alerts when something new touches their area.